


Carol M. Highsmith took this public-domain photograph.
Investors ask six kinds of question. Loom answers each one with evidence.
Every example below uses real companies and the figures Loom actually holds for them. None of it is a recommendation, and every example shows evidence that you would weigh for yourself.
“I am thinking about buying shares in a company. What should I understand first?”
Without Loom, you would download several years of annual reports, rebuild the figures in a spreadsheet, listen to recent calls and search the news, and that takes days for one company.
With Loom, the company page brings five years of filed figures, the margins, the free cash flow and a valuation together, beside management's record on its own guidance and the ranked findings from its documents.
The tour shows the company page in detail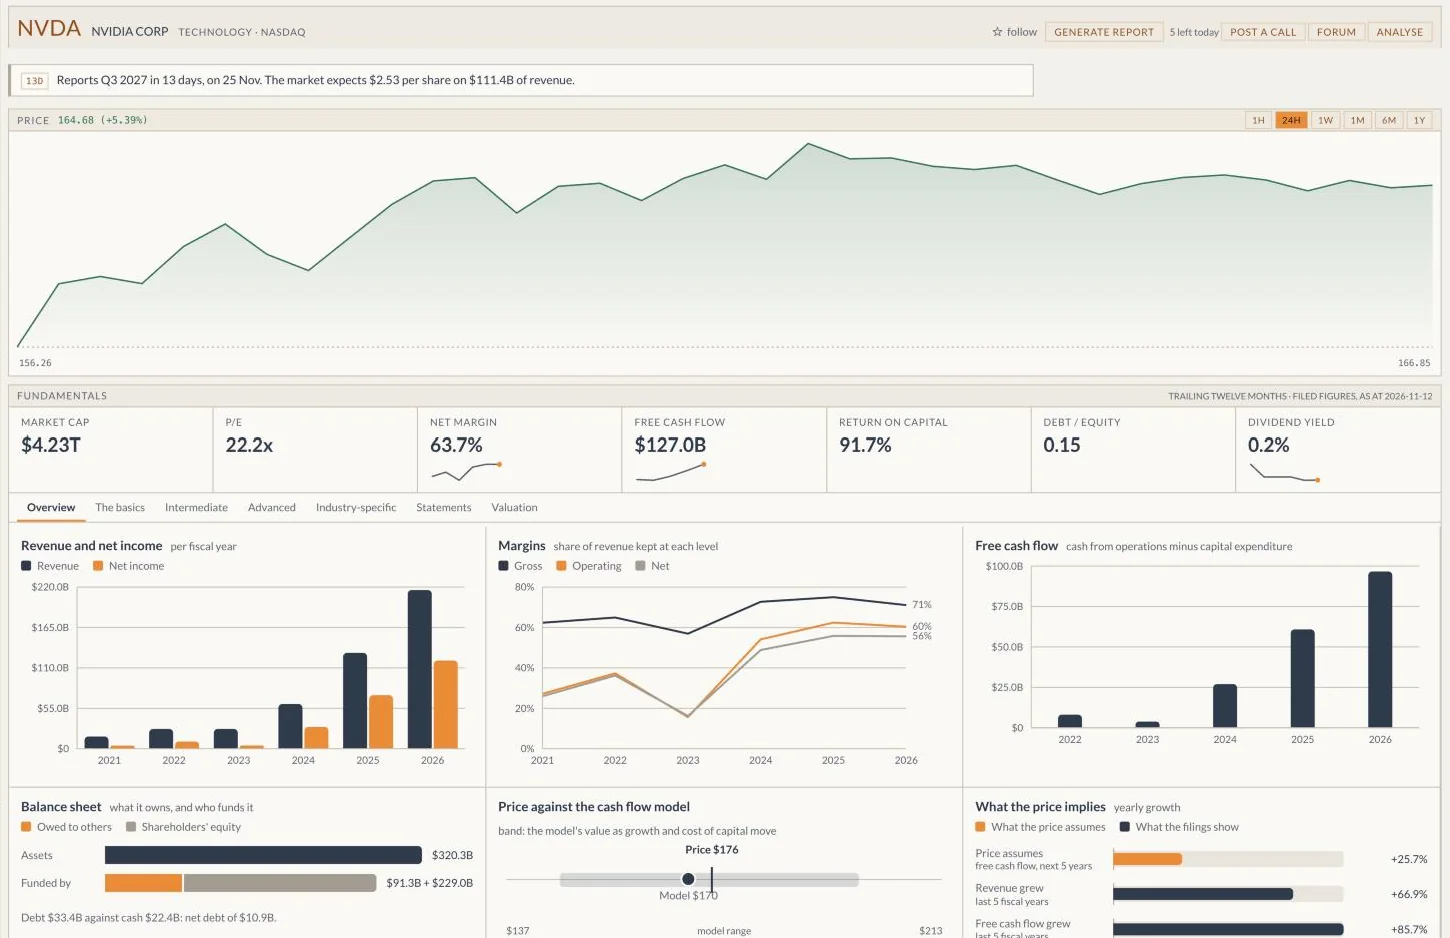
“Apple says memory is getting more expensive. Where does it say so, and how much does it matter?”
Without Loom, you would search a long annual report and a call transcript for the right passages, then guess whether anything like this has mattered before.
With Loom, the disclosure appears in both documents with each passage quoted, each finding says how it was established, and Loom shows what followed comparable disclosures at other technology companies, which is usually less than a headline suggests.
Apple filed this passage in its annual report on Form 10-K on 3 November 2026.
“The Company is experiencing supply constraints and rising costs driven by industry-wide supply-demand imbalances for key components, including advanced semiconductors, memory and storage. The Company expects these trends to intensify for memory and storage components.”
Apple's management said this on its earnings call for the fourth quarter of fiscal 2026, held on 2 November 2026.
“When you remove the tariff refunds from both the June and September quarter, both company and products gross margin would be down about 1 point sequentially, primarily driven by higher memory costs.”
“The company is growing quickly. Is the business actually getting stronger?”
Without Loom, you would need to read the cash flow statement as closely as the income statement, year by year, and notice where the two part ways.
With Loom, the statements sit side by side. Microsoft's revenue nearly doubled over five fiscal years while its free cash flow barely moved, because its capital expenditure rose more than fivefold. Loom also flags shifts like this one at Nvidia: revenue growth slowed from 114% to 65%, a fall of 49 points.
- Light bars show Microsoft's revenue for each fiscal year ending in June.
- Orange bars show its free cash flow for the same years.
“Is the price asking more of the company than it has ever delivered?”
Without Loom, you would build a discounted cash flow model, research a beta and a cost of capital, and then solve the model backwards by trial and error.
With Loom, the model runs both ways. It values the cash flows under stated assumptions, calculates the growth the current price already assumes and sets that beside what the filings show.
You can try the model yourself33%Microsoft's price of $523.88 assumes free cash flow grows this fast each year in the coming years.
15%Microsoft's filings show revenue growing this fast each year over five fiscal years.
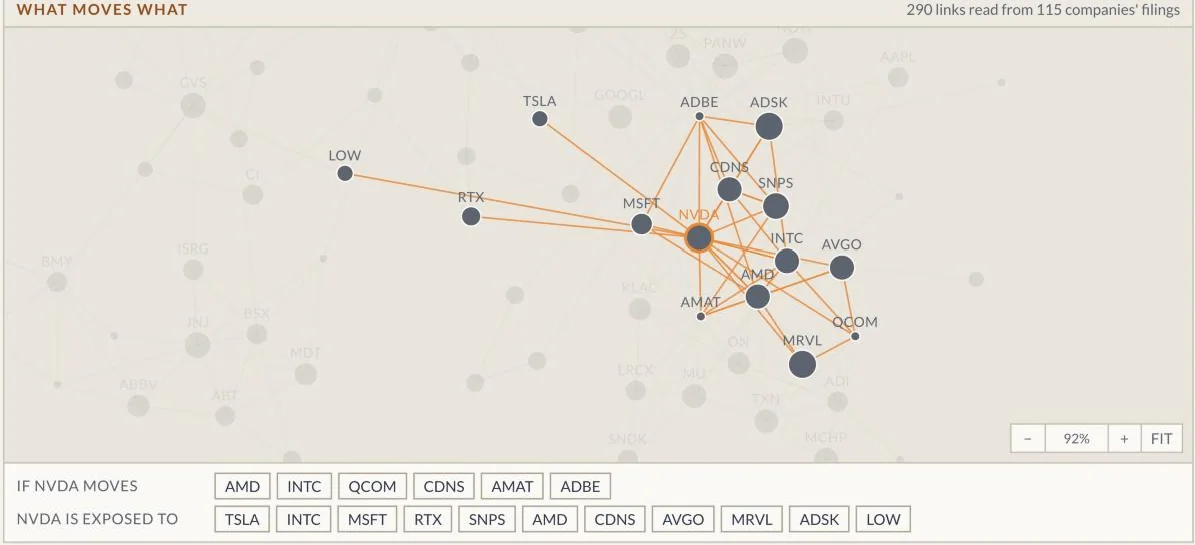
“Something has happened to a supplier. Which of the companies I follow are exposed to it?”
Without Loom, you would have to remember which companies depend on which, and then read each of their filings to check.
With Loom, the suppliers, customers and risks that companies name in their own annual reports form a map, so Loom can list who is exposed when one company moves. Loom also collects the supply constraints executives name on earnings calls and shows which companies they reach.
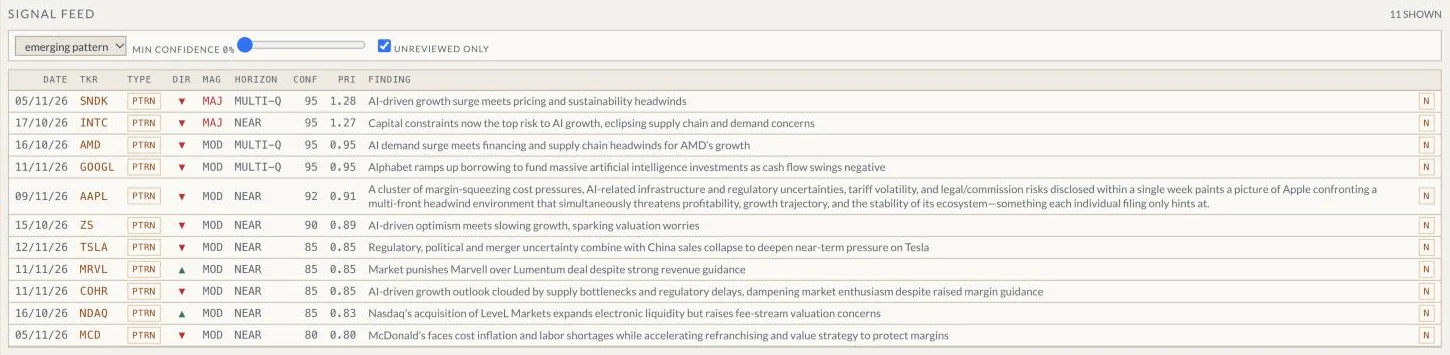
“What changed this week in the companies I hold, and does any of it need my attention?”
Without Loom, you would check each company's filings, news and executive share trades by hand every week, and you could still miss the one that mattered.
With Loom, you record each holding with what you paid and when. Loom works out your position, puts your companies first on every page, keeps their next reports and the economic calendar in view, and emails you when something changes.


You can ask any of these questions about a company you care about.
Loom collects filings for more than 6,000 companies on the NYSE and Nasdaq. The answers come with their sources, and the decision stays with you.